Blogging with Joe Bloggs
This section isn't ready yet, sorry!
One could use this setup to write a blog short updates.
Hey there! I'm Sherman.
You can read more about me here, or you can see some of my favorite projects in my portfolio. Soon there will be some more in-depth write-ups on the blog (currently under construction).
I'm a recent graduate of Toulouse School of Economics, receiving a Master's degree in Statistics and Econometrics with experience building machine learning models for social science research. I have an affinity for Natural Language Processing and value interpretability.
I'm a very curious person and I'm always finding new topics to explore. Recently I've been learning about DSP Digital Signal Processing and participating in the BirdCLEF2022 Kaggle Competition.
Want to know more? Have a project you think I'd be interested in?
Contact me!
The website is based off of John Doe by @cadars. It's minimal and fast, with no javascript. I also use a bit of PHP to build the portfolio section and permalinks.
This section isn't ready yet, sorry!
One could use this setup to write a blog short updates.
Honestly you don't want to know.
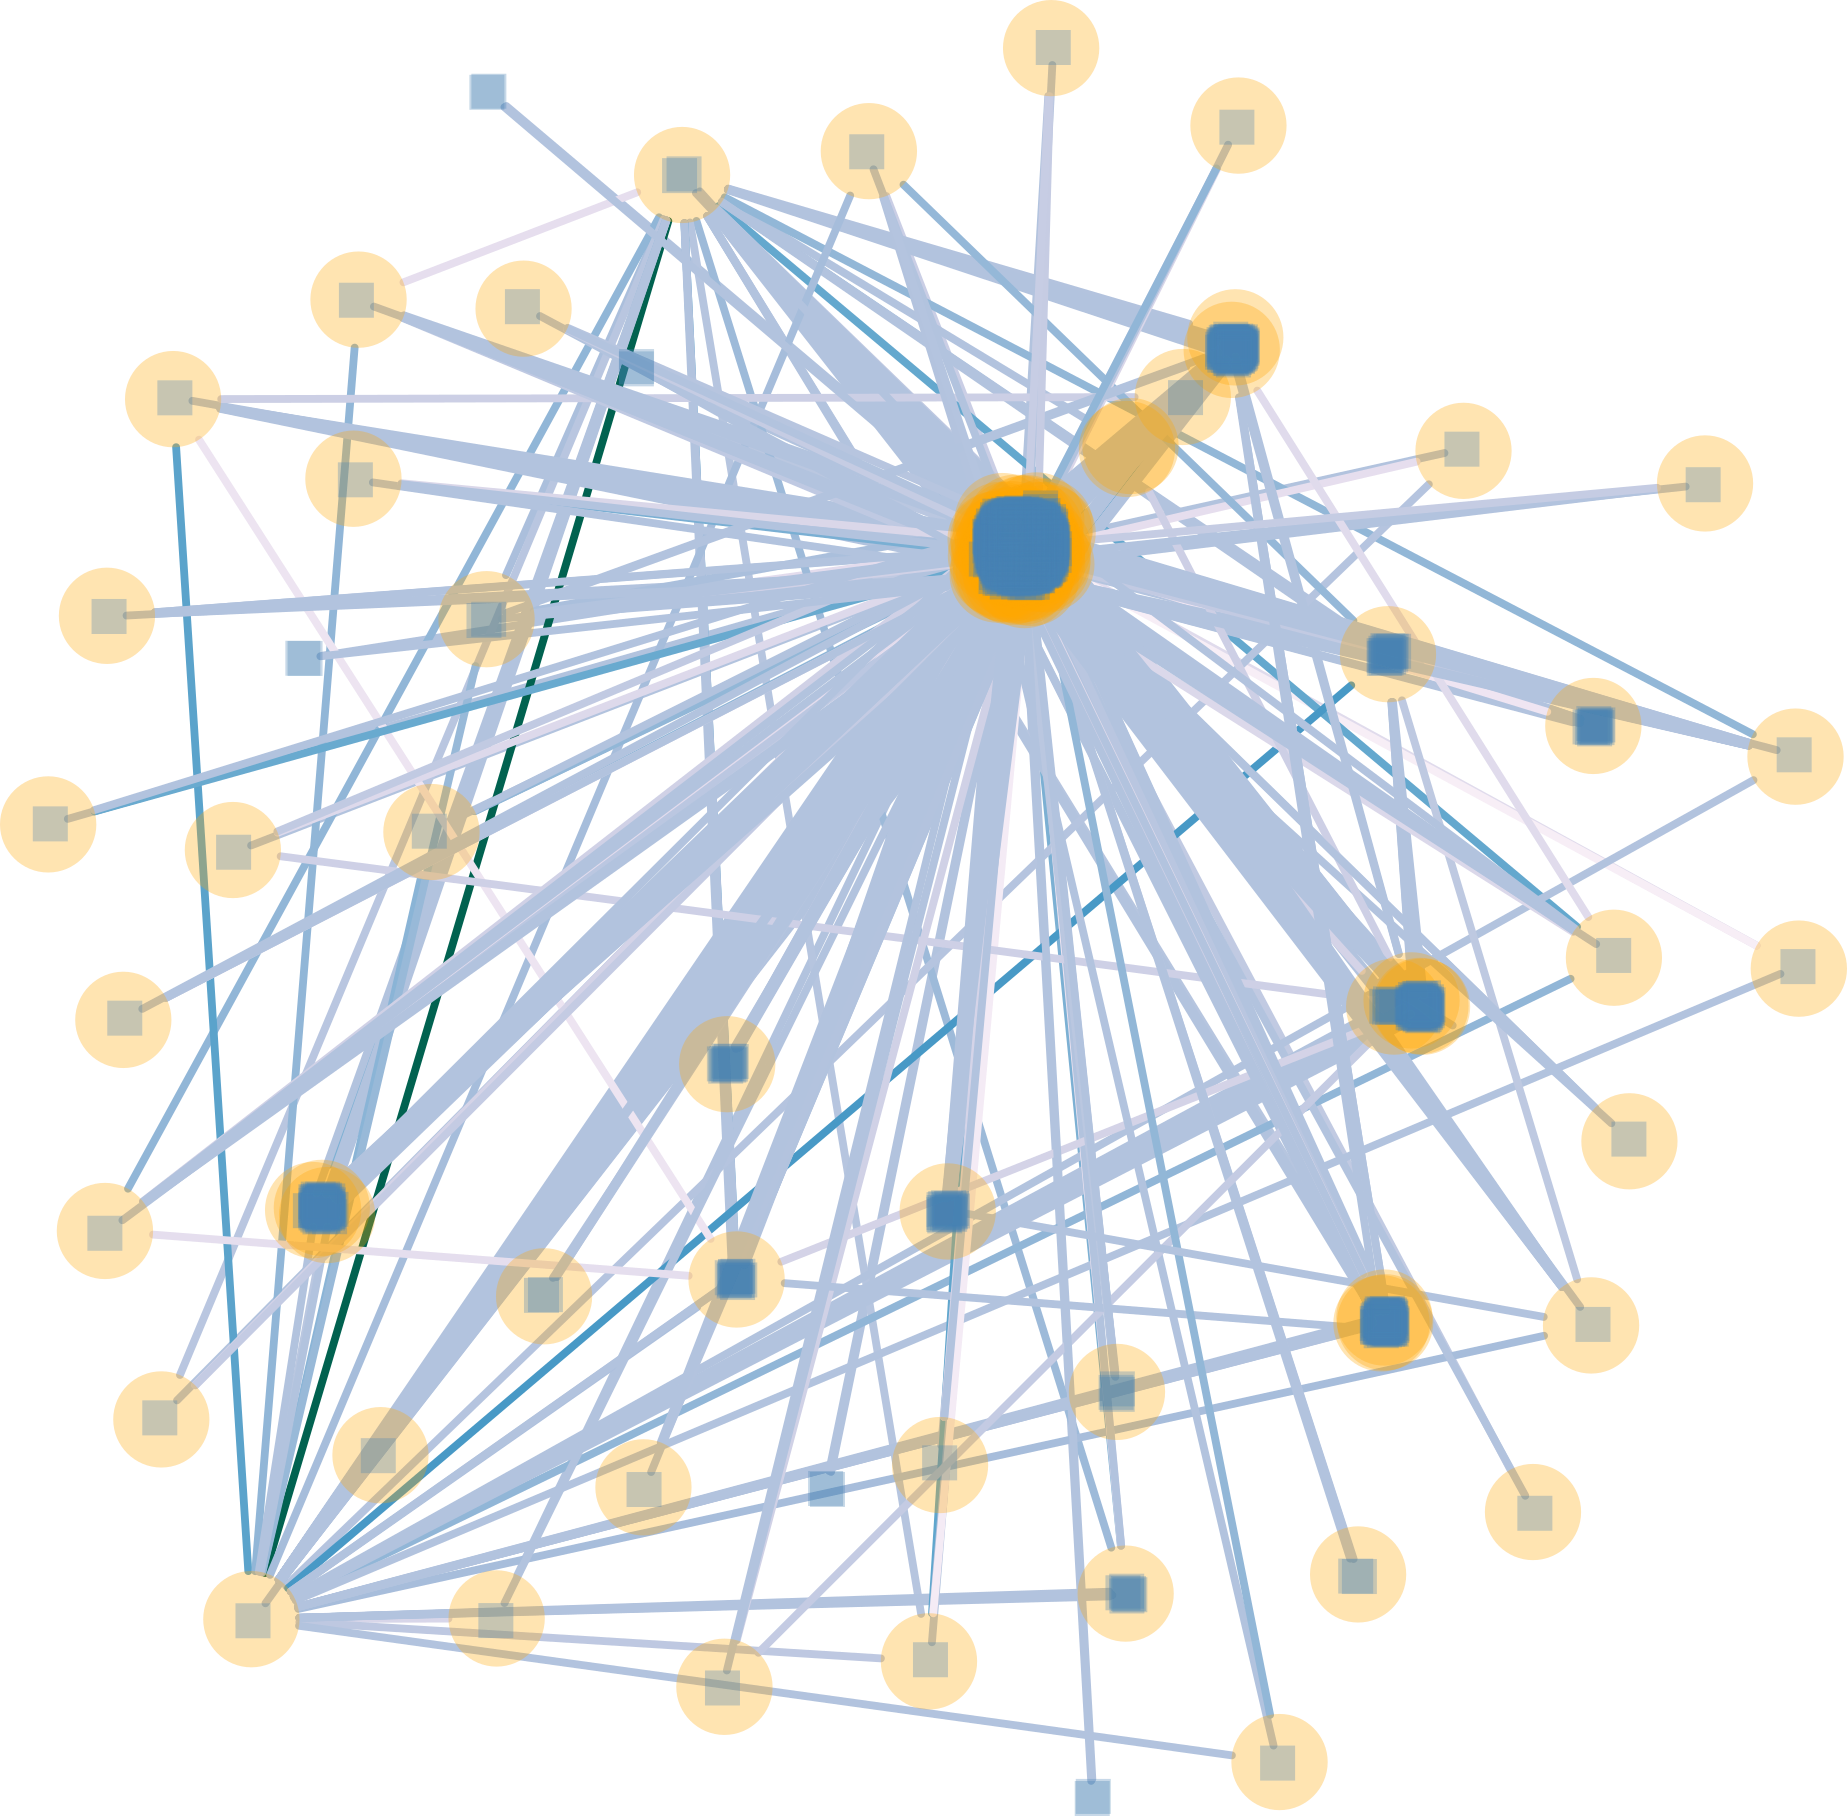
This paper was the final project for my Graph Analytics class at TSE. The goal of this project was to investigate the structure of Wikipedia editors, applying various network modelling tools.
The first step was to reshape the data. The original structure of the dataset was focused on the interaction between users and documents (document-user edges). In order to examine user interaction within a page, I used timestamps for each document to infer which user made an edit after another user, creating (user-user edges).
After building the graph and selecting a connected subgraph, different characteristics were calculated and visualized. These included Closeness, Betweenness, Eccentricity. The network was also compared against null models Erdos-Renyi and Barabasi-Albert models, to determine that our network has significant connectedness and low transitivity.
Finally, Annealing, Louvain and Hierarchical clustering were performed and the optimal modularity scores were calculated. We discovered that hierarchical clustering gave the best modularity, giving an insight into how Wikipedians interact with each other when editing articles.
The dataset is available through konect.cc. It is a bipartite edit network of Chinese-language Wikipedia edit events built from public Wikimedia data. Edits consist of edges connected to a specific document, along with timestamp metadata.
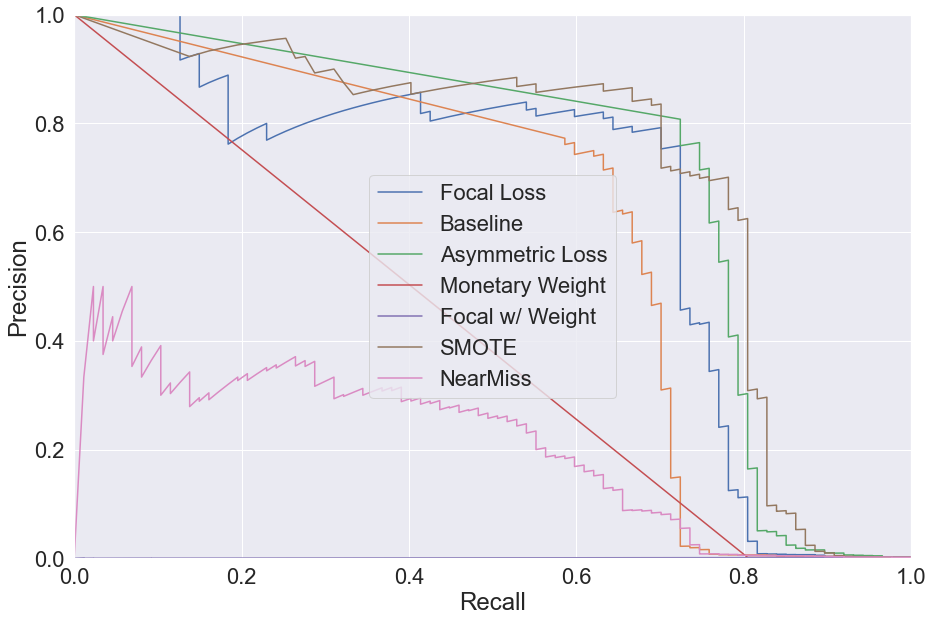
This was the final project for a class on Machine Learning at TSE. The goal was to research and evaluate different methods for dealing with imbalanced data. Classification of imbalanced data can pose unique challenges when a certain type of erros is more costly than another. Credit card fraud is a good example: false negatives are more costly than false positives. Additionally, fraud is underrepresented in the data which makes it more difficult to train a model for it.
We implemented and evaluated 7 different methods. 5 of htese were loss based, including the novel approach Asymmetric Loss and one state of the art method Focal Loss. 2 of the methods were sampling based.
Evaluation and recommendations were given in two different contexts:
In the general context, Asymmetric loss had the best performance thanks to a large ROC-AUC and rapid convergence. In the application to fraud detection, Asymmetric loss was also the best choice due to minimizing monetary losses and having good Prectision-Recall.
To evaluate the different approaches, the ROC-AUC curve, model speed, and reliability of convergence were examined.
For this project a public dataset of labelled credit card fraud data. Features consisted of 28 columns from PCAPrincipal Component Analysis alongside time and transaction amount.
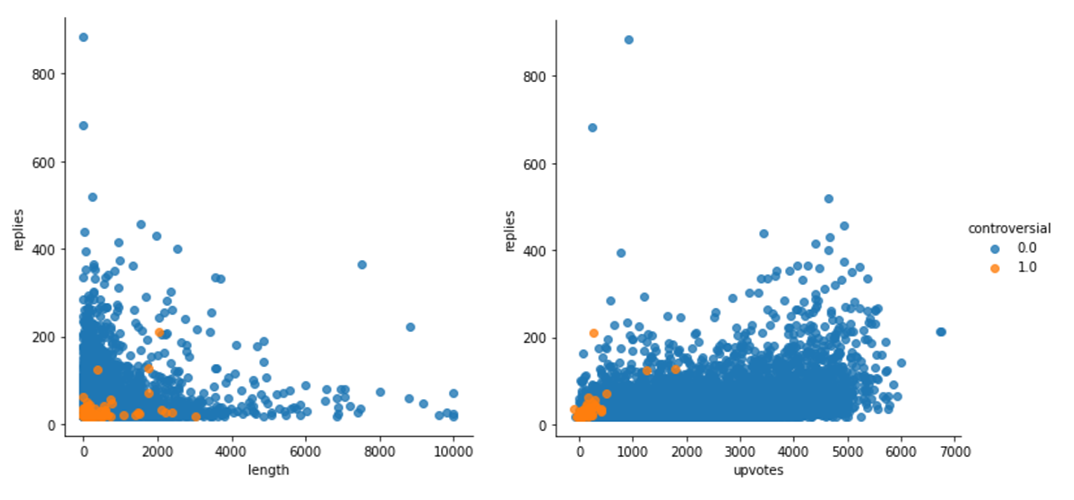
This paper was the final project for my Databases class at TSE. The goal of this project was to build an SQL database from several CSV files containing social media data and use aggregation and analytic commands to perform an EDA Exploratory Data Analysis.
Moving beyond this, I wanted to disentangle the relationship between controversy and engagement. In the modern media climate, it is often lamented that shock and offense are an easy way to find an audience. However, Reddit uses upvotes and downvotes, so would this still apply?
In order to investigate this I built an aggregate function which efficiently counted the number of replies a post recieved. This was done by counting the number of comments with a matching ID in the reply field.
The most interesting results from the exploratory analysis were that for our high-reply controversial subset, upvotes stayed positive but for the low-reply (representative) controversial subset, average upvotes were normally dispersed around 0. This may show that, in fact, Reddit upvotes and replies are highly correlated and thus for the most part use of upvotes is not used to express an opinion. And in this way Reddit does not increase engagement through controversial content.
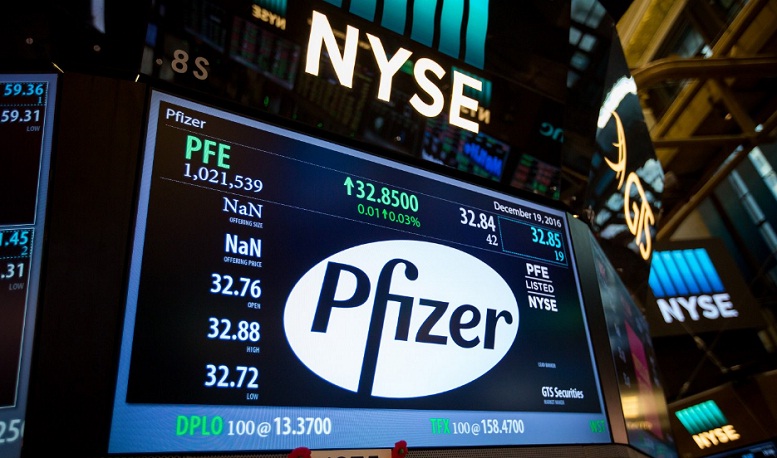
This paper was the final project for my Extreme Value Theory class at TSE. The goal of this project was to detect extreme values longitudinal stock price data from Pfizer, and examine the differences between two methods.
The Pfizer stock was chosen as a good candidate for this project due to their work developing vaccine and the resulting bullishness in the market. Not only is there the impact of the global pandemic, but also expectations from investors surrounding news of vaccine development. Thus we should expect some extreme values due to these shocks.
Two different approaches were used to detect extreme values: block maxima approach and peaks over threshold approach. The former involves fitting a GEVGeneralized Extreme Value distribution and performing model selection. The latter involves choosing an appropriate threshold and fitting a stationary GPD.Generalized Pareto Distribution In both cases a return level plot is then derived and calculate an estimate of the 100-year return level and confidence intervals.
In our application we found that both methods achieved similar predictions, but the peak over threshold approach had smaller confidence intervals.
The dataset is available at the FRED website. In R it can be downloaded by running getSymbols("PFE",source="yahoo") with the quantmod package.
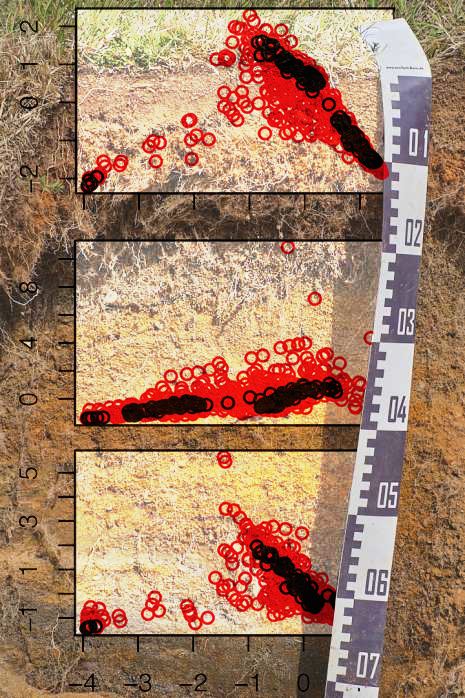
This project was part of my class on Outlier Detection at TSE. We first focus on robustness measures by calculating sensitivity to outliers for a selection of estimators. Then two different multivariate outlier detection methods are evaluated.
A sensitivity curve show visually how an estimator responds to a new value being included. If the function is bounded (as x grows, the estimator eventually stops changing) then that estimator is considered to be B-Robust. For a set of scale and location estimators, we calculate sensitivity curves and compare the results. From all of our estimators we then determined that median, trimmed mean, Huber-M, MAD, and IQR are B-robust.
In the second section, robust Mahalanobis distance, ordinary MD Mahalanobis Distance, and the Lof method are compared. First we discuss the methods and their properties, then we compare them. We discuss affine invariance, distinguishability between methods, computational ease and the explainability of each method.
We used a dataset of chemical compositions from the bottom layer of agricultural soils in Northern Europe. 768 samples on an irregular grid were taken in two different layers, the top layer (0-20cm) and the bottom layer covering 1,800,000 km2. We select a subset of 6 elements found in the soil - Silicum dioxide, Titanium dioxide, Aluminium oxide, Iron oxide, Manganese oxide and Magnesium oxide. This subset was chosen specifically because reveals differences in different outlier methods.
To download the same subset of the data that we used you can run df <- bssbot[, c(5:10)] with the package mvoutlier in R.
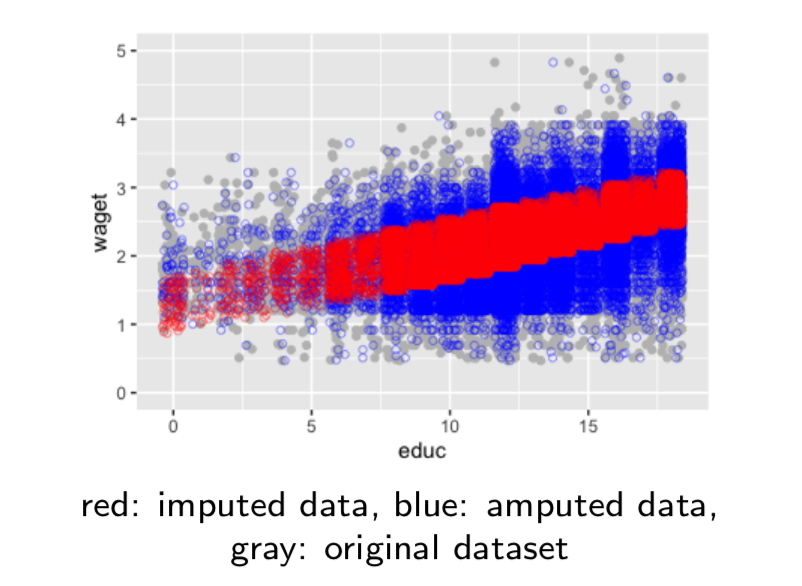
In this project we explain the methodology behind three different imputation techniques, single regression imputation,bootstrap multiple imputation, and iterative PCA Principal Component Analysis imputation. We then run a simulation to evaluate and compare their benefits and drawbacks.
Our simulation is repeated five times. It involves generating missing data using the MCAR mechanism Missing Completely at Random in order to reimpute it with each technique. With this simulation we can estimate a mean, and compare it to the true mean to evaluate bias. We also observe the variance across mean estimates from each repetition.
In addition to explaining the mechanism behind each technique, we explain any mathematical properties of them and necessary assumptions. To evaluate the three methods we compare their resulting parameter estimates (mean and variance) against the parameters of the original model.
We find that PCA and Boostrap imputation are roughy equivalent and Regression imputation perforsm the worst. PCA imputation approximates variance to the original data well, but this model cannot always be used due to reliance on strict assumptions. Bootstrap on the other hand, relies on much fewer assumptions. Regression imputation should only be used when the data is already known to be highly correlated.

This project was part of my Web Mining class at TSE. The goal of this project was to build useful features based on domain knowledge, build and iteratively improve a prediction model.
As a starting point for our model, we partially replicated Conversation Modeling on Reddit Using a Graph-Structured LSTM by Victoria Zayats and Mari Ostendorf, representing the hierarchy and temporality of posts using a graph structure.
We extend this model by building additional features from the text which act as indicators of the quality and nature of a post: capitalization, length, punctuation, links, emojis.
After building these two sets of features, we trained a lightGBM model on teh features and comment scores.
The dataset is available on Kaggle and consists of approx. 200,000 comments and associated metadata.
